mirror of
https://github.com/Relintai/pandemonium_engine_easy_charts.git
synced 2024-11-12 10:15:19 +01:00
2.4 KiB
2.4 KiB

Charts for Godot Engine, made easy.
How does it work?
There is a WIKI with some tutorials, even if it is a work in progress.
You can also find practical examples in addons/easy_charts/examples/.
Available Charts and when to use them
This library offers a set of charts for each main Godot Node:
- Control Charts: Fast Charts plotted in a Control Node. They offer basic Control properties, such as Margins, size inheritance and control. No animations, best suited for UIs that rely on Control Node structures.
- 2D Charts: plotted in 2D Nodes. They offer additional tools, such as animations. They can be used to implement more aesthetic charts in 2D contexts. Compatibility not guaranteed in Canvas and Control nodes.
- 3D Charts: Plotted using 3D nodes, but can be used both in 2D and 3D spaces. They offer the possibility to plot 3D datasets, which are common in machine learning contexts or just data analysis. A Camera Control will also be available, which can be used to move around the chart.
Available Charts
| Control | 2D | 3D | |
|---|---|---|---|
| ScatterChart | ✅ | ❌ | ❌ |
| LineChart | ✅ | ❌ | ❌ |
| BarChart | ✅ | ❌ | ❌ |
| AreaChart | ❌ | ❌ | ❌ |
| PieChart | ❌ | ❌ | ❌ |
| RadarChart | ❌ | ❌ | ❌ |
| BubbleChart | ❌ | ❌ | ❌ |
| DonutChart | ❌ | ❌ | ❌ |
| ParliamentChart | ❌ | ❌ | ❌ |
| SunburstChart | ❌ | ❌ | ❌ |
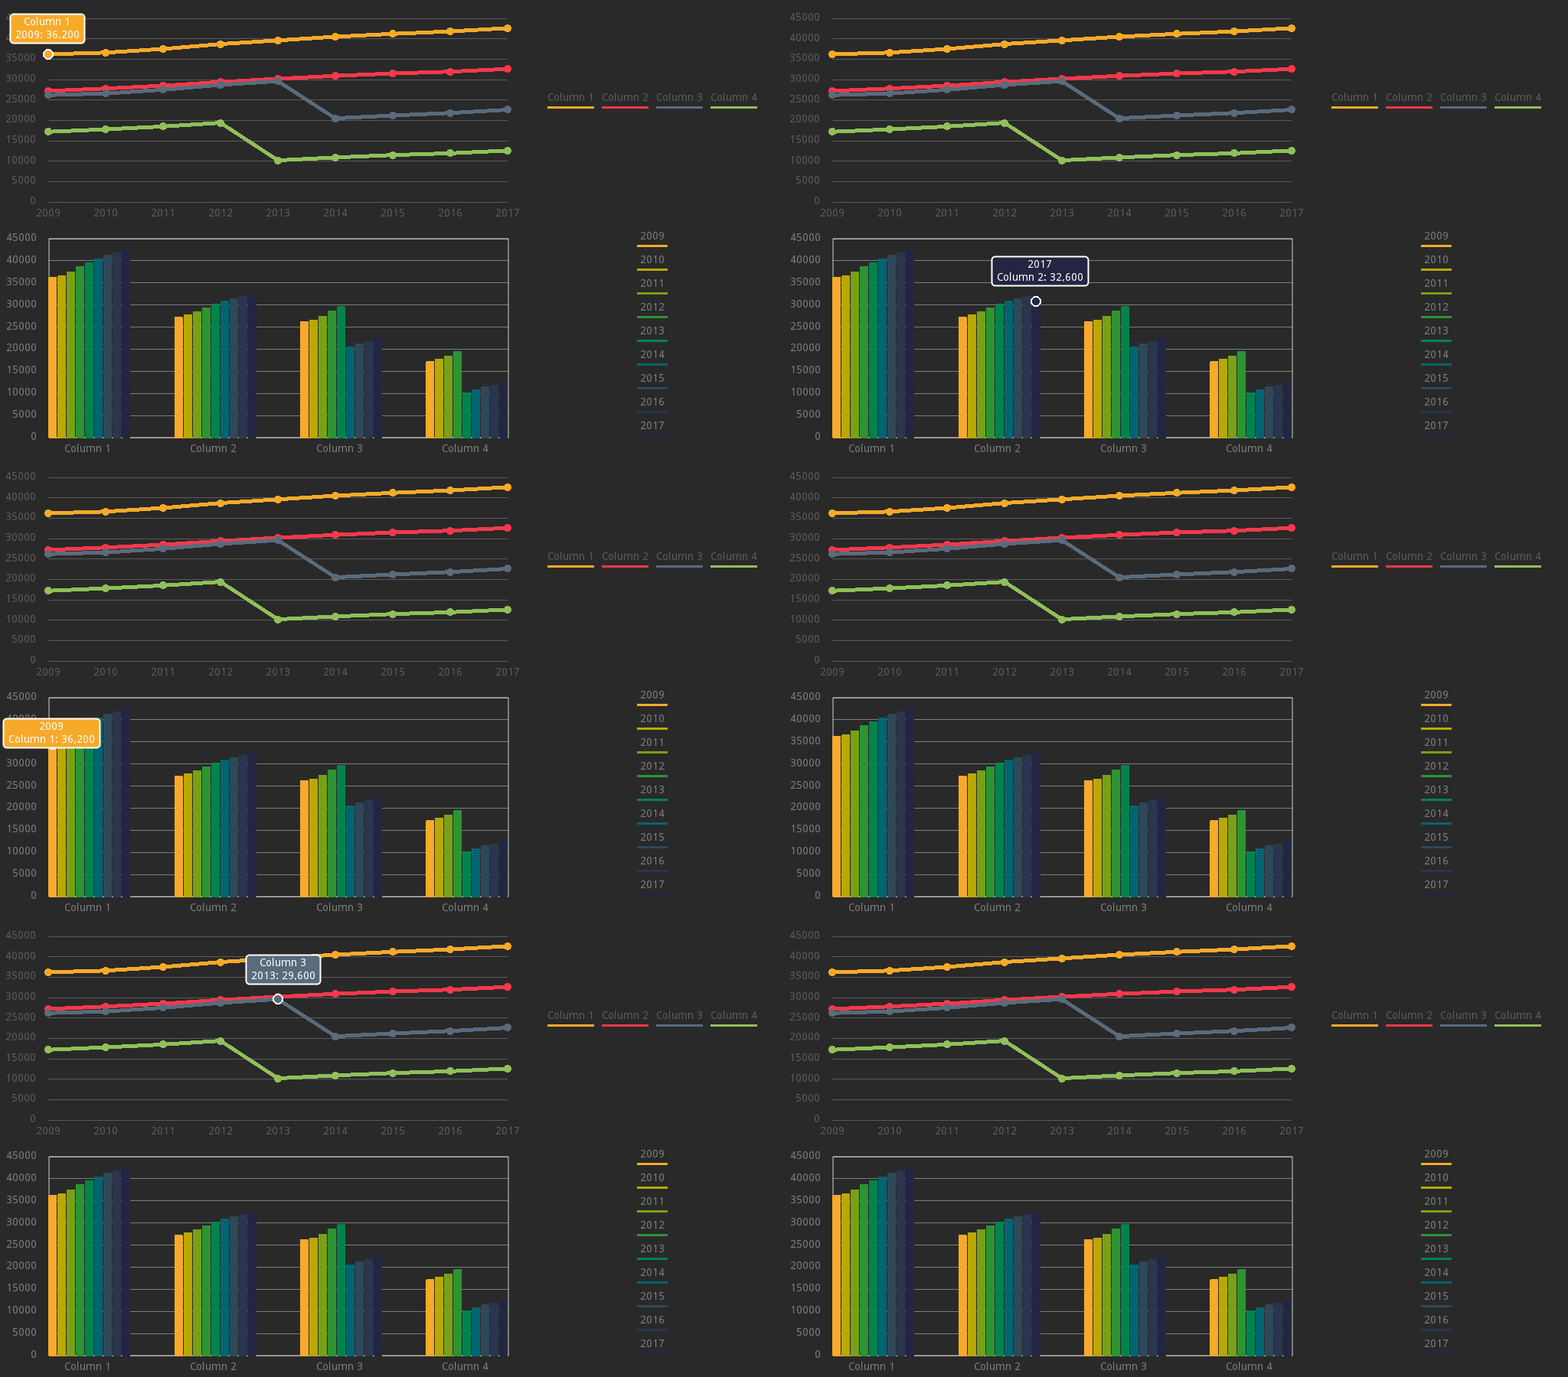
Some Examples
Some references for charts and plots
Flourish
Chart.js
Google Charts
Warning
This addon was built for a personal use intention. It was released as an open source plugin in the hope that it could be useful to the Godot Engine Community. As a "work in progress" project, there is no warranty for any eventual issue and bug that may broke your project.
I don't assume any responsibility for possible corruptions of your project. It is always advisable to keep a copy of your project and check any changes you make in your Github repository.


